All published articles of this journal are available on ScienceDirect.

Color Stability and Color Recovery of Single-shade Restorative Resin Composites: An In-Vitro Study

Abstract
Introduction
Single-shade restorative resin composites simplify shade selection, but their color stability and response to whitening mouthrinses remain uncertain. This in-vitro study evaluated their staining susceptibility and subsequent color response.
Materials and Methods
A total of 360 specimens (6 × 2 mm) were prepared from three single-shade restorative resin composites and one nanohybrid control. Specimens were immersed in distilled water, coffee, or red wine for 1 month (n = 30). They then underwent a 4-week protocol using one of two peroxide-free whitening mouthrinses (n = 15). Color was measured three times with a spectrophotometer at baseline, after immersion, and after mouthrinse application. CIEDE2000 color differences were analyzed using analysis of variance and multiple linear regression (p < 0.05).
Results
Material and immersion medium significantly affected color change (p < 0.001). At 1 month, red wine caused the greatest change (12.74 ± 2.50 to 21.53 ± 1.99), followed by coffee (7.80 ± 2.35 to 13.88 ± 2.27); distilled water produced the lowest values. The response to mouthrinse application varied by material and medium. Residual color difference decreased in most red-wine groups but increased in some distilled-water and coffee groups. Complete color recovery was not achieved.
Discussion
CDO was the most susceptible material, whereas OMN and ESQ were more resistant. Reduced lightness was the predominant component of staining.
Conclusion
Staining and the response to mouthrinse application were material- and medium-dependent. Peroxide-free mouthrinses did not consistently reduce residual color differences across all experimental groups.
1. INTRODUCTION
Achieving an optimal color match remains a key determinant of success in esthetic dental restorations. The inherently polychromatic nature of natural teeth makes shade selection a complex clinical task. Conventional resin composite systems, available in multiple shades with varying translucencies and opacities, may complicate restorative procedures, increase material inventory, and prolong chairside time. To overcome these limitations, materials exhibiting a “chameleon effect” or blending ability have been introduced, allowing restorations to visually integrate with surrounding tooth structure [1]. In conventional resin composites, color matching is primarily achieved through the incorporation of pigments. However, recently developed single-shade restorative resin composites aim to achieve color adaptation through optical interactions rather than relying solely on pigment-based shade matching. These materials utilize complex light interactions, including scattering, reflection, and transmittance, to harmonize with adjacent dental tissues. In some systems, this behavior has been associated with the concept of structural color, in which the interaction of light with the material microstructure contributes to the perceived color rather than intrinsic pigmentation [2]. However, not all single-shade restorative resin composites rely on identical optical mechanisms, and variations in composition and microstructure may result in differences in their color adjustment performance.
Despite these advancements, resin composite restorations remain susceptible to staining over time due to both intrinsic and extrinsic factors. Intrinsic staining originates within the material itself, arising from chemical alterations in the polymer network and from degradation at the bond between matrix and filler [3]. Extrinsic staining, by contrast, results from the adsorption and absorption of chromogenic substances from the oral environment. Frequently consumed beverages such as coffee and red wine, as well as oral hygiene products including mouthrinses, have been reported to significantly influence the color stability of resin-based materials [4]. The extent of staining is strongly associated with material composition, with more hydrophilic resin matrices generally exhibiting increased water sorption and a greater tendency for pigment uptake [5].
These compositional effects can be traced to two features of composite formulation in particular. Resins polymerized from TEGDMA take up considerably more water than those based on UDMA, with Bis-GMA falling between the two, so that the proportion of hydrophilic diluent in the matrix largely determines how much fluid, and with it, how much dissolved colorant, the network can accommodate [3, 6]. The inorganic phase acts as a second determinant, since filler quantity and geometry have likewise been implicated in the optical behavior of these materials; earlier work comparing several single-shade restorative resin composites under beverage immersion reported color changes that differed appreciably from one product to another [7].
Therefore, the aim of this study was to evaluate the color stability of three recently introduced single-shade restorative resin composites, using a conventional nanohybrid composite as a control. The primary objective was to assess their susceptibility to staining following exposure to commonly consumed chromogenic beverages. The secondary objective was to evaluate the extent of color recovery achieved with mouthrinse application. The following null hypotheses were tested:
- Immersion in different media (distilled water as control, coffee, and red wine as staining solutions) does not significantly affect the color stability of single-shade restorative resin composites;
- There is no significant difference in color stability among the tested restorative resin composite materials;
- Mouthrinse application does not produce a significant color recovery in stained single-shade restorative resin composites.
2. MATERIALS AND METHODS
2.1. Specimen Preparation
Three single-shade restorative resin composites (Omnichroma, OMN, Tokuyama Dental, Tokyo, Japan; Vittra APS Unique, VTR, FGM Dental Group, Joinville, Brazil; Charisma Diamond One, CDO, Kulzer GmbH, Hanau, Germany) and one nanohybrid restorative resin composite serving as the control (Estelite Sigma Quick, ESQ, Tokuyama Dental, Tokyo, Japan) were evaluated in this study. The composition and manufacturer details of the tested materials are presented in Table 1.
| Resin Composites | Resin Matrix | Filler Type & Particle Size | Filler Content (%wt/ %vol) | Category | Manufacturer |
|---|---|---|---|---|---|
|
Omnichroma (OMN) |
UDMA, TEGDMA | Spherical SiO2-ZrO2, 260 nm | 79 / 68 | Supra-Nanofil | Tokuyama, Japan |
|
Vittra APS Unique (VTR) |
UDMA, TEGDMA | Nanospheres of a zirconia complex, Photoinitiator composition (APS), 200 nm | 82 / 72 | Nanohybrid | FGM, Brazil |
|
Charisma Diamond ONE (CDO) |
TCD-DI-HEA, UDMA, TEGDMA | B2O3–F Al2O3-SiO2, silica, TiO2, fluorescent pigments, metallic oxide pigments, organic pigments, 5–20 µm | 81 / 64 | Nanohybrid | Kulzer, Germany |
|
Estelite Sigma Quick (ESQ) |
BISGMA, TEGDMA | Spherical SiO2-ZrO2, 100-300 nm | 82 / 71 | Supra-Nanofil | Tokuyama, Japan |
A total of 360 disc-shaped specimens were fabricated, with 90 specimens for each of the four restorative resin composite materials. The specimens were prepared using a custom-fabricated polytetrafluoroethylene mold, 6 mm in diameter and 2 mm thick. The diameter was determined by the measuring tip of the spectrophotometer, so that the entire measuring area remained within the specimen surface and each reading was obtained from a defined and reproducible region. Dimensioning specimens in relation to the probe diameter is an established approach in spectrophotometric studies of resin composites, as it limits variation in probe positioning between readings [8, 9]. The 2 mm thickness corresponds to the maximum increment reliably polymerized in a single step according to ISO 4049 and is among the thicknesses most commonly adopted in in-vitro color stability studies [8].
The mold was positioned on a glass slide, filled with the composite material, and covered with a transparent polyester matrix strip (Mylar, DuPont, Wilmington, DE, USA) and a second glass slide. Gentle pressure was applied to produce a standardized flat surface, without the use of finishing or polishing procedures that may affect surface characteristics. Each specimen was light-cured for 20 seconds in standard mode (1000 mW/cm2) using an LED polymerization unit (Valo, Ultradent, South Jordan, UT, USA), delivering a radiant exposure of 20 J/cm2. Since the emitting tip of the unit (9.5 mm) exceeded the specimen diameter, the entire surface was covered by a single exposure without the need for overlapping irradiation. This exposure time is consistent with the manufacturer's instructions for a 2 mm increment and with previous reports indicating that a 20-second exposure at this irradiance produces a depth of cure exceeding 2 mm [10].
2.2. Experimental Groups and Immersion Protocol
After polymerization, all specimens were stored in distilled water at 37°C for 24 hours. Within each composite material, the 90 specimens were numbered and allocated to the three immersion groups (n = 30 per group) by simple randomization without replacement:
- Group 1: Distilled water (Control)
- Group 2: Coffee solution, prepared by dissolving 2 g of instant coffee powder (Nescafé Classic, Single Bags; Nestlé, Bursa, Turkey) in 100 mL of boiling water
- Group 3: Red wine (Doluca Öküzgözü, Tekirdağ, Turkey)
Specimens were immersed in their respective solutions in separate glass bottles and stored at 37°C for 30 days. The immersion media were refreshed every 24 hours to ensure consistent exposure.
2.3. Color Recovery Protocol
After the 30-day immersion period, each main group (n = 30) was subdivided by the same randomization procedure into two subgroups (n = 15, GR1 and GR2), each assigned to one of two commercially available peroxide-free whitening mouthrinses (Listerine Advanced White, GR1, Johnson & Johnson, Skillman, NJ, USA; Colgate Optic White, GR2, Colgate-Palmolive, New York, NY, USA). The composition of the mouthrinses is presented in Table 2. The protocol, adapted from Ntovas et al. [11], involved immersing the specimens in 25 mL of the assigned mouthrinse for 60 seconds under continuous agitation, followed by rinsing under running water for 30 seconds and re-immersion in a fresh solution for an additional 60 seconds. This sequence, corresponding to two consecutive mouthrinse applications, was repeated seven times to simulate one week of use. The entire protocol was subsequently repeated over four consecutive weeks. Between cycles, specimens were stored in distilled water at 37°C.
| Mouthwashes | Content | Manufacturer |
|---|---|---|
| Listerine Advanced White (GR1) |
Aqua, Sorbitol, Propylene Glycol, Tetrapotassium Pyrophosphate, Citric Acid, Pentasodium Triphosphate, Poloxamer 407, Aroma, Sodium Methyl Cocoyl Taurate, Eucalyptol, Caprylyl Glycol, Thymol, Sodium Saccharin, Menthol, Sodium Fluoride, Sucralose | Italy |
| Colgate Optic White (GR2) |
Aqua, Glycerin, Propylene Glycol, Sorbitol, Tetrapotassium Pyrophosphate, Polysorbate 20, Tetrasodium Pyrophosphate, Zinc Citrate, PVM/MA Copolymer, Aroma, Benzyl Alcohol, Sodium Fluoride, Sodium Saccharin, CI 42051 | Colgate-Palmolive, Poland |
2.4. Color Measurement
Color measurements were performed using a clinical spectrophotometer (VITA Easyshade V, VITA Zahnfabrik, Bad Säckingen, Germany) under standardized D65 illumination with a 45°/0° geometry [12]. A laboratory-fabricated box was used to block ambient light and ensure a standardized white background for all measurements. The device was calibrated before each measurement session. Three consecutive readings were obtained from each specimen, and the mean L*, a*, and b* values were recorded at each of the following time points:
- T0: Baseline (after 24-hour immersion in distilled water)
- T1: After 1 week of immersion in staining solutions
- T2: After 1 month of immersion in staining solutions
- T3 (GR1, GR2): After the 4-week color recovery protocol
The color difference (ΔE00) was calculated using the CIEDE2000 formula:

The parametric factors KL , KC and KH were set to constant values of 1.0. The clinical acceptability threshold for ΔE00 was defined as 2.25 units [13].
Color change during the staining period was calculated relative to baseline as ΔE00 (T1/T0) and ΔE00 (T2/T0) for 1 week and 1 month, respectively. The effect of mouthrinse application was evaluated using two complementary approaches:
(1) color change after mouthrinse application relative to post-staining values, expressed as ΔE00 (T3/T2), to assess the magnitude of color recovery,
(2) color change relative to baseline, expressed as ΔE00 (T3/T0), to determine the overall color difference after completion of the experimental protocol.
2.5. Statistical Analysis
Sample size was verified using G*Power (Version 3.1.9.7, Heinrich-Heine-Universität Düsseldorf, Düsseldorf, Germany). For a fixed-effects two-way design (four materials × three immersion media), detection of a medium effect size (f = 0.25) at α = 0.05 with a power of 0.95 required 341 specimens in total, a requirement exceeded by the 360 specimens prepared in the present study; a sensitivity analysis confirmed that effect sizes of f ≥ 0.24 for the main effects and their interaction were detectable at this power.
Statistical analysis was performed using jamovi (Version 2.6, The jamovi Project, Sydney, Australia). Descriptive statistics were calculated for all experimental groups. The normality of the data distribution was assessed using the Kolmogorov-Smirnov and Shapiro-Wilk tests, and the homogeneity of variances was examined using Bartlett's test. Since the data were normally distributed and group sizes were identical across all experimental conditions, parametric analyses were applied, as analysis of variance is robust to departures from variance homogeneity under balanced designs. Two-way ANOVA and the Tukey HSD multiple comparison tests were used to determine the statistical differences between groups. For staining and color recovery phases, ΔE00 values were compared with two-way ANOVA and the Tukey HSD test. Also, repeated-measures ANOVA was used to evaluate the time-dependent changes of values. Multiple linear regression analysis was performed to investigate the relationship between ΔE00 and its components (ΔL′, ΔC′, ΔH′). The level of statistical significance was set at p < 0.05.
3. RESULTS
3.1. Staining Phase
Descriptive statistics for all experimental groups are presented in Table 3. The homogeneity of variances was not confirmed (Bartlett's test, p < 0.001 at both time points), reflecting the progressive increase in variability as color change increased; since group sizes were identical throughout, parametric analyses were retained.
| Immersion Period | Staining Solution | Omnichroma (OMN) | Vittra APS Unique (VTR) | Charisma Diamond One (CDO) | Estelite Sigma Quick (ESQ) |
|---|---|---|---|---|---|
| 1 Week (T1) | Distilled Water | 1.15 ± 0.45 ᵃ, ᴬ | 2.04 ± 0.85 ᵇ, ᴬ | 2.36 ± 1.04 ᵇ, ᴬ | 1.96 ± 0.70 ᵇ, ᴬ |
| Coffee | 2.20 ± 0.72 ᵃ, ᴮ | 4.58 ± 1.04 ᵇ, ᴮ | 6.52 ± 0.94 ᶜ, ᴮ | 4.36 ± 2.60 ᵇ, ᴮ | |
| Red Wine | 5.53 ± 0.93 ᵃ, ᶜ | 6.78 ± 1.12 ᵇ, ᶜ | 11.02 ± 1.55 ᶜ, ᶜ | 5.46 ± 1.59 ᵃ, ᴮ | |
| 1 Month (T2) | Distilled Water | 2.54 ± 0.69 ᵃ, ᴬ | 3.55 ± 1.11 ᵇ, ᴬ | 2.92 ± 1.20 ᵃᵇ, ᴬ | 2.09 ± 1.12 ᵃ, ᴬ |
| Coffee | 7.80 ± 2.35 ᵃ, ᴮ | 11.67 ± 1.78 ᵇ, ᴮ | 13.88 ± 2.27 ᶜ, ᴮ | 8.63 ± 1.58 ᵃ, ᴮ | |
| Red Wine | 13.75 ± 3.19 ᵇ, ᶜ | 20.69 ± 1.88 ᶜ, ᶜ | 21.53 ± 1.99 ᶜ, ᶜ | 12.74 ± 2.50 ᵃ, ᶜ |
ΔE00 was significantly affected by the immersion medium, the composite material, and the immersion duration (p < 0.001), and a significant interaction between material and immersion medium was observed at both time points. At one week, the immersion medium accounted for the largest share of the variance (F2,348 = 542.63, p < 0.001, partial η2 = 0.757), followed by the material (F3,348 = 138.95, p < 0.001, partial η2 = 0.545) and their interaction (F6,348 = 28.71, p < 0.001, partial η2 = 0.331). The same pattern was more pronounced at one month (medium, F2,348 = 1674.85, p < 0.001, partial η2 = 0.906; material, F3,348 = 162.29, p < 0.001, partial η2 = 0.583; interaction, F6,348 = 36.33, p < 0.001, partial η2 = 0.385).
After one week, coffee and red wine produced ΔE00 values exceeding the clinical acceptability threshold in most materials, whereas specimens stored in distilled water remained close to it (Table 3). Red wine produced the greatest color change, ranging from 5.46 ± 1.59 in ESQ to 11.02 ± 1.55 in CDO, followed by coffee, ranging from 2.20 ± 0.72 in OMN to 6.52 ± 0.94 in CDO. Pairwise comparisons showed that CDO differed significantly from all other materials in both coffee and red wine, whereas OMN and ESQ did not differ from one another in red wine (Tukey HSD, p < 0.05).
At one month, ΔE00 increased in all immersion media (Table 3). Red wine again produced the greatest change, ranging from 12.74 ± 2.50 in ESQ to 21.53 ± 1.99 in CDO, with VTR and CDO exceeding 20 units and not differing significantly from one another. In coffee, values ranged from 7.80 ± 2.35 in OMN to 13.88 ± 2.27 in CDO, with OMN and ESQ forming a single homogeneous subset and CDO differing significantly from all other materials. Specimens stored in distilled water remained at or near the acceptability threshold throughout the experimental period, ranging from 2.09 ± 1.12 in ESQ to 3.55 ± 1.11 in VTR.
The contribution and direction of the individual color parameters at one month are presented in Fig. (1) and in the regression analysis shown in Table 4. The models explained a substantial proportion of the variance in ΔE00 (adjusted R2 = 0.85–0.99). In both the coffee and red wine groups, ΔL′ showed the most consistent contribution, and its predominantly negative values indicated a reduction in lightness. ΔC′ contributed variably, particularly in the red wine groups, whereas ΔH′ showed smaller and less consistent effects across the tested materials.
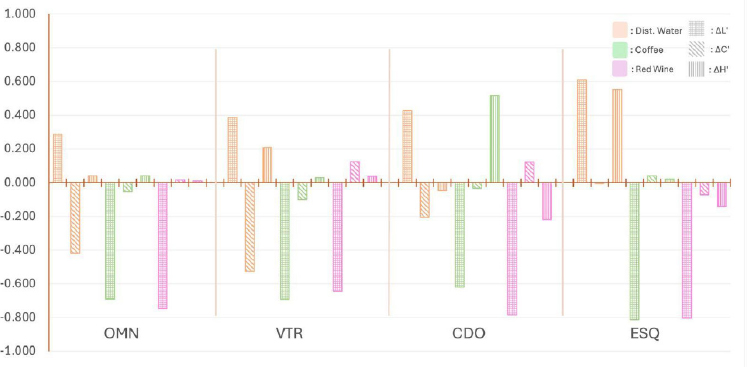
Contribution of color components (ΔL′, ΔC′ and ΔH′) to the overall color change (ΔE00) at the 1-month time point (T2). The x-axis groups the four composite materials within each immersion medium; the y-axis represents the regression coefficient for each color component, with negative values indicating a reduction in the corresponding parameter. OMN: Omnichroma; VTR: Vittra APS Unique; CDO: Charisma Diamond One; ESQ: Estelite Sigma Quick..
| Material | Staining Solution | R | R2 | Adjusted R2 | Std. Error | p (ΔL′) | p (ΔC′) | p (ΔH′) |
|---|---|---|---|---|---|---|---|---|
| OMN | Distilled Water | 0.905 | 0.819 | 0.799 | 0.307 | <.001 | <.001 | 0.622 |
| Coffee | 0.999 | 0.998 | 0.998 | 0.107 | <.001 | 0.001 | 0.233 | |
| Red Wine | 0.999 | 0.998 | 0.998 | 0.131 | <.001 | 0.186 | 0.726 | |
| VTR | Distilled Water | 0.975 | 0.950 | 0.942 | 0.266 | <.001 | <.001 | 0.031 |
| Coffee | 0.993 | 0.986 | 0.984 | 0.227 | <.001 | 0.057 | 0.844 | |
| Red Wine | 0.990 | 0.979 | 0.976 | 0.291 | <.001 | <.001 | 0.784 | |
| CDO | Distilled Water | 0.933 | 0.871 | 0.854 | 0.457 | <.001 | 0.069 | 0.705 |
| Coffee | 0.998 | 0.996 | 0.996 | 0.144 | <.001 | 0.225 | <.001 | |
| Red Wine | 0.993 | 0.986 | 0.985 | 0.246 | <.001 | 0.002 | 0.307 | |
| ESQ | Distilled Water | 0.979 | 0.958 | 0.953 | 0.243 | <.001 | 0.852 | 0.040 |
| Coffee | 0.997 | 0.994 | 0.993 | 0.133 | <.001 | 0.037 | 0.887 | |
| Red Wine | 0.998 | 0.996 | 0.995 | 0.172 | <.001 | 0.003 | 0.319 |
3.2. Color Recovery Phase
Descriptive statistics for the color recovery phase are presented in Tables 5 and 6. As in the staining phase, the assumption of equal variances was not satisfied (Bartlett's test, p < 0.001 for all four datasets), and parametric analyses were retained on the basis of the balanced design.
| Mouthrinse Group | Staining Solution | Omnichroma (OMN) | Vittra APS Unique (VTR) | Charisma Diamond One (CDO) | Estelite Sigma Quick (ESQ) |
|---|---|---|---|---|---|
| GR1 / T2 | Distilled Water | 3.66 ± 0.49 ᶜ, ᴮ | 1.33 ± 0.83 ᵃ, ᴬ | 2.33 ± 0.88 ᵇ, ᴬ | 1.30 ± 0.92 ᵃ, ᴬ |
| Coffee | 1.70 ± 0.76 ᵃ, ᴬ | 2.53 ± 1.32 ᵃᵇ, ᴬ | 3.69 ± 2.30 ᵇ, ᴬᴮ | 1.38 ± 0.86 ᵃ, ᴬ | |
| Red Wine | 6.94 ± 1.33 ᵃᵇ, ᶜ | 7.91 ± 1.96 ᵇ, ᴮ | 5.34 ± 3.10 ᵃ, ᴮ | 8.72 ± 2.69 ᵇ, ᴮ | |
| GR2 / T2 | Distilled Water | 3.33 ± 0.48 ᵇ, ᴮ | 1.46 ± 0.62 ᵃ, ᴬ | 1.54 ± 0.84 ᵃ, ᴬ | 1.75 ± 0.43 ᵃ, ᴬ |
| Coffee | 1.83 ± 0.78 ᵃ, ᴬ | 1.98 ± 1.69 ᵃ, ᴬ | 1.97 ± 1.06 ᵃ, ᴬ | 4.81 ± 3.37 ᵇ, ᴮ | |
| Red Wine | 8.10 ± 1.96 ᵃᵇ, ᶜ | 10.25 ± 2.67 ᵇᶜ, ᴮ | 5.91 ± 2.51 ᵃ, ᴮ | 13.30 ± 4.60 ᶜ, ᶜ |
| Mouthrinse Group | Staining Solution | Omnichroma (OMN) | Vittra APS Unique (VTR) | Charisma Diamond One (CDO) | Estelite Sigma Quick (ESQ) |
|---|---|---|---|---|---|
| GR1 / T0 | Distilled Water | 5.58 ± 0.31 c, A | 3.41 ± 0.94 b, A | 3.86 ± 0.86 b, A | 1.62 ± 0.55 a, A |
| Coffee | 7.58 ± 2.14 a, B | 10.74 ± 1.9 b, B | 11.47 ± 2.02 b, B | 7.94 ± 2.18 a, B | |
| Red Wine | 11.32 ± 2.43 b, C | 14.52 ± 2.63 c, C | 18.83 ± 3.22 d, C | 6.04 ± 1.38 a, B | |
| GR2 / T0 | Distilled Water | 5.65 ± 0.71 c, A | 3.85 ± 1.63 b, A | 2.59 ± 0.94 a, A | 1.62 ± 0.65 a, A |
| Coffee | 10.28 ± 2.23 a, B | 12.06 ± 1.18 a, B | 12.29 ± 2.52 a, B | 13.3 ± 4.45 a, C | |
| Red Wine | 6.4 ± 0.65 b, A | 10.87 ± 0.74 c, B | 14.91 ± 1.34 d, B | 3.93 ± 1.24 a, A |
The magnitude of color change produced by the mouthrinse protocol, expressed as ΔE00 (T3/T2), was significantly affected by the immersion medium in both subgroups (GR1, F2,168 = 179.14, p < 0.001, partial η2 = 0.681; GR2, F2,168 = 215.11, p < 0.001, partial η2 = 0.719). In GR1, the material main effect was not significant (F3,168 = 0.34, p = 0.795), indicating that the extent of change during the protocol was comparable across the four composites. In contrast, a significant material effect was present in GR2 (F3,168 = 20.02, p < 0.001, partial η2 = 0.263). A significant material × medium interaction was observed in both subgroups (p < 0.001). The largest changes occurred in the red wine groups, reaching 8.72 ± 2.69 in GR1 and 13.30 ± 4.60 in GR2, both in ESQ (Table 5).
When evaluated relative to baseline (Table 6), ΔE00 remained above baseline in every group, indicating that none of the specimens returned to their original color. Both the immersion medium and the composite material exerted significant effects in the two subgroups (GR1, medium F2,168 = 343.72, material F3,168 = 83.32; GR2, medium F2,168 = 329.23, material F3,168 = 33.81; all p < 0.001), together with significant interactions (p < 0.001). Residual color difference was highest in the red wine groups of GR1, ranging from 6.04 ± 1.38 in ESQ to 18.83 ± 3.22 in CDO, and in the coffee groups of GR2, ranging from 10.28 ± 2.23 in OMN to 13.30 ± 4.45 in ESQ. Across most conditions, CDO and VTR retained higher residual color differences, whereas ESQ generally presented the lowest values.
4. DISCUSSION
The present findings confirm that extrinsic staining remains a critical challenge for contemporary resin composites, including single-shade systems. Although these materials are engineered to achieve optical blending through structural color mechanisms, their susceptibility to chromogenic beverages is largely dictated by matrix composition and surface characteristics. Based on these findings, all null hypotheses were rejected, as color stability was significantly influenced by the immersion medium, differed among materials, and was affected by mouthrinse application.
Red wine produced the greatest staining at both evaluation periods, an effect attributable to the combined action of ethanol, low pH, and anthocyanin pigments, with ethanol softening the polymer network and facilitating colorant diffusion into the matrix [14]. Coffee produced smaller but still clinically perceptible changes [15], whereas distilled water induced minimal alteration, indicating that water sorption alone is insufficient to produce perceptible staining over the period studied [16].
Differences in color stability among the tested materials may be associated with variations in resin matrix composition and filler characteristics. The greater staining observed in CDO may be linked to its higher content of hydrophilic monomers, such as TEGDMA, which are known to increase water sorption and facilitate pigment diffusion [3, 7]. Chen et al., who evaluated the same material under coffee immersion followed by an in-office bleaching procedure, likewise attributed its pronounced color change to the combination of a higher TEGDMA content and a comparatively coarse filler architecture, noting that larger filler sizes correlate negatively with color stability [17]. Increased water uptake may also contribute to matrix plasticization and potential alterations at the filler–matrix interface, thereby promoting deeper pigment penetration.
In contrast, OMN exhibited relatively lower color change, particularly in the coffee and distilled water groups. This observation may be associated with its uniform spherical filler structure, which has been reported to yield the smoothest and glossiest surface among several monochromatic composites, with correspondingly lower staining after coffee immersion [18]. Nevertheless, given that detailed surface topography and roughness parameters were not evaluated, this explanation remains speculative. Overall, the present findings suggest that both monomer composition and filler architecture may contribute to staining behavior, in agreement with previous reports [7], although further investigations are required to confirm these mechanisms.
What distinguishes single-shade materials is the route by which they arrive at their final appearance: shade is generated optically, through the way incident light is scattered by the filler phase, rather than being fixed in advance by pigments. Anything that modifies the filler–matrix assembly therefore acts directly on the mechanism responsible for shade generation, so that a stained restoration risks losing not only its original color but also the blending behavior that motivated its selection. The two extremes of the present series illustrate how much filler architecture matters: OMN, built on spherical particles confined to a narrow size range, changed least across the immersion media, whereas CDO, whose filler is coarser by an order of magnitude, changed most. Duzyol et al. observed the same ranking when comparable products were exposed to chromogenic beverages [7].
Following staining, both mouthrinses produced measurable, yet limited, color recovery. This finding is consistent with previous reports indicating that peroxide-free mouthrinses mainly affect superficial staining and have reduced efficacy against pigments that have penetrated the resin matrix [11, 19]. The limited reversal observed in the present study may therefore be attributed to the depth of pigment penetration rather than solely to surface staining. Differences among studies in substrate, staining protocol, mouthrinse formulation, and measurement methodology limit direct comparison [20].
Regression analysis provided additional insight into the nature of color change. The models accounted for most of the variance in ΔE00, with adjusted R2 exceeding 0.85 in the majority of groups. Among these, ΔL′ showed the strongest and most consistent association with overall color change. The negative ΔL′ values observed in coffee and red wine groups suggest that staining was primarily characterized by a reduction in lightness rather than isolated changes in chroma or hue. Although ΔC′ contributed in certain groups, particularly those exposed to red wine, its effect was secondary to changes in lightness. The contribution of ΔH′ was generally limited [21].
The predominance of the lightness parameter is consistent with previous regression-based studies [22, 23], which also identified ΔL′ as the primary determinant of perceptible color change. While intrinsic staining models have reported increases in lightness during water storage [22], the present extrinsic staining model demonstrated the opposite trend. This contrast suggests that, although the direction of change may vary depending on the underlying mechanism, lightness remains the dominant factor influencing esthetic outcomes.
The partial color recovery achieved with mouthrinse application further supports this interpretation. Since staining was primarily associated with a decrease in lightness, incomplete reversal may indicate that superficial cleaning is insufficient to counteract pigments that have diffused into the polymer network. This limitation appears more pronounced in red wine groups, where both darkening and chroma changes were involved [11, 19].
From a clinical perspective, these findings suggest that monitoring changes in lightness may provide a more sensitive indicator of early staining than relying solely on global ΔE00 values. Although single-shade restorative resin composites may initially provide satisfactory blending, repeated exposure to chromogenic agents may result in progressive color alteration that is not fully reversible with over-the-counter whitening products.
Specimens were polymerized against Mylar strips without additional finishing or polishing in order to obtain standardized, smooth surfaces. Mylar-formed surfaces exhibit lower roughness than polished surfaces [24], and polishing may introduce microscopic irregularities that increase susceptibility to staining [25]. This approach therefore allowed material-related properties to be evaluated with minimal interference from surface variables.
This study has several limitations. Specimens were evaluated with Mylar-formed surfaces in order to isolate material-related behavior from the influence of finishing and polishing; consequently, the findings do not indicate how these materials perform once clinically relevant surface treatments have been applied. Continuous immersion represents a more demanding challenge than habitual beverage consumption and does not reproduce salivary buffering, pellicle formation, or mechanical wear. Water sorption, degree of conversion, and surface topography were not measured directly, and the compositional explanations proposed above therefore remain inferential. Finally, the subgroup size used for the color recovery protocol was sufficient to detect large differences between the two mouthrinses, and smaller differences may have remained undetected. Further studies incorporating surface treatment, cyclic staining models and direct measurement of surface parameters would extend these observations toward intraoral conditions.
CONCLUSION
Within the limitations of this in vitro study, staining of single-shade restorative resin composites was both material- and medium-dependent, with red wine producing the greatest color change and CDO being the most susceptible material, while OMN and ESQ were the most resistant. Loss of lightness was the predominant component of color change. The effect of mouthrinses was dependent on the material and staining medium. Although a reduction in residual color difference was observed in most red-wine groups, complete color recovery was not achieved, and some distilled-water and coffee groups showed an increased color difference from baseline after mouthrinse application.
AUTHORS’ CONTRIBUTIONS
It is hereby acknowledged that all authors have accepted responsibility for the manuscript's content and consented to its submission. They have meticulously reviewed all results and unanimously approved the final version of the manuscript.
LIST OF ABBREVIATIONS
| OMN | = Omnichroma |
| ESQ | = Estelite Sigma Quick |
| CDO | = Charisma Diamond One |
AVAILABILITY OF DATA AND MATERIALS
The data that support the findings of this study are available from the corresponding author upon reasonable request.
ACKNOWLEDGEMENTS
Declared none.